


Today in Rock History
Today in Rock History is a music orientated segment where we would like to encourage readers to share their thoughts and tastes in music and discuss the various aspects of any music topic.
Keep reading
More Free Speech Not Less Is Needed
If we really want to tackle the rise in hate online (which recent debates seem to suggest we do), public order legislation and the weight of the criminal law will never work. It is only through open and public debate and better education that we can enact change.
Keep reading
Why the Woke Really Hate Hume
Philosopher David Hume proved that facts don’t care about hurty feelings, 250 years ago.
Keep reading
The BFD Stuff Up of the Day
Check out the latest media stuff ups both locally and around the world.
Keep reading
Laughter Is the Best Medicine
This regular daily post is the place to joke and banish negative thoughts.
Keep reading
What Are They up to in There?
Tasmania’s “Gender Service” lurks in the shadows, away from public scrutiny.
Keep reading
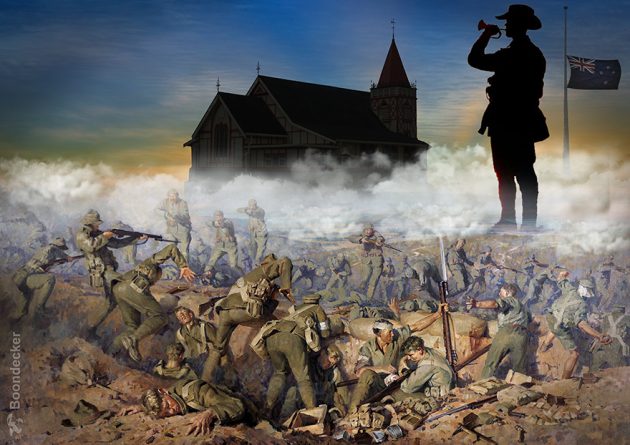
Christchurch Soldier Maintains Strong Family Connection With Gallipoli
Corporal Johns’ strong military heritage makes representing the New Zealand Defence Force (NZDF) at the services in Türkiye on 25 April extra significant, in particular at the Anzac Commemorative Site and also atop the sun-scorched heights of Chunuk Bair.
Keep reading
One of These Things Is Just Like the Other
The toxic similarities between mandatory vaccination and fluoridation – both medical treatments forced on to the public by way of politics under the guise of science is concerning (to put it mildly).
Keep reading
It’s off to Rwanda for You, Illegals
With an election imminent, the UK PM has an important win on illegal immigration.
Keep reading
Read at Your Own Risk
The sensitive content herein is to be read at your own risk and demands a health warning. It is the duty of New Zealand Doctors Speaking Out…
Keep reading
A Good Government Should Not Be Afraid to Rule
The core issue with National’s Three Strikes law isn’t that it won’t work. It’s that it doesn’t go far enough.
Keep reading

Remembering Why They Fell
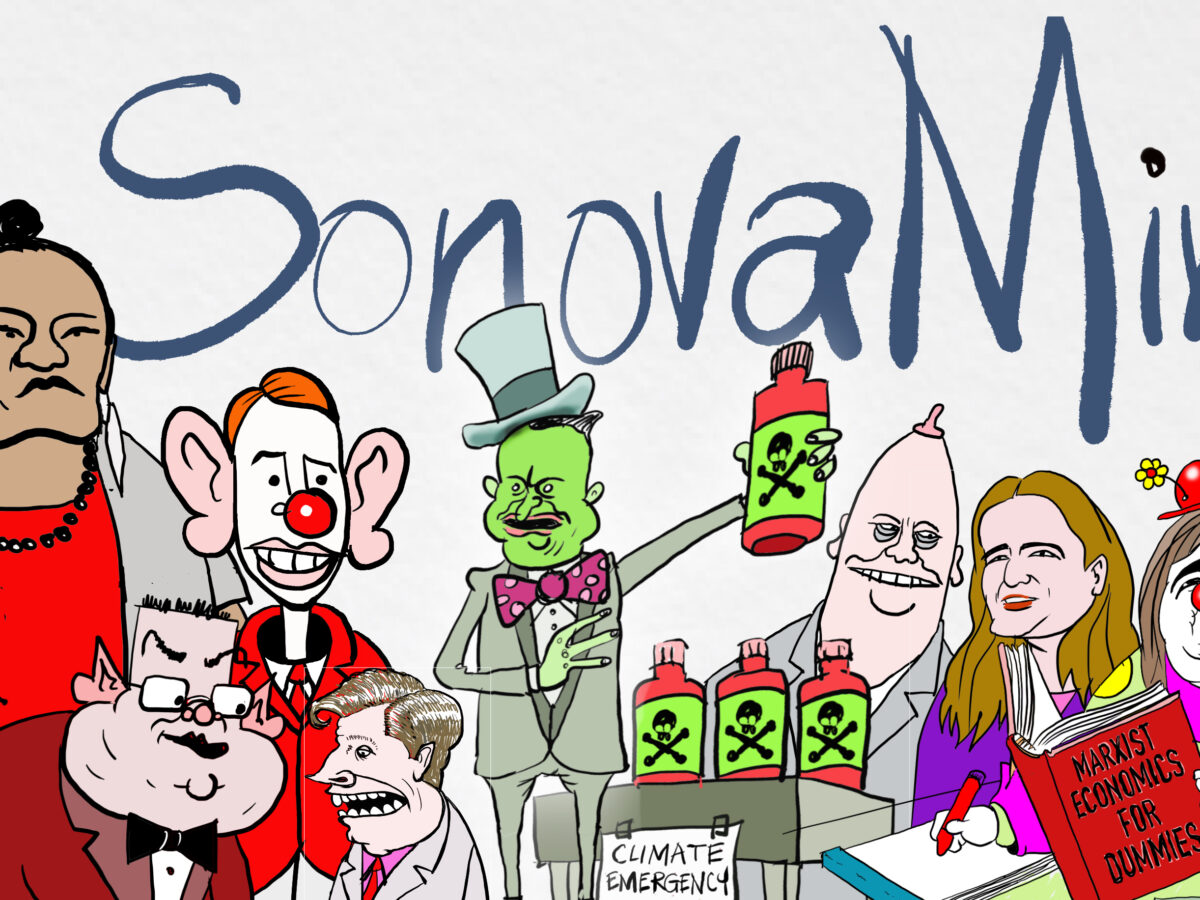
You do NOT want to miss out on seeing today’s cartoon.
Sign up today for a Bronze level membership to enjoy both SonovaMin and BoomSlang’s daily cartoons.
Keep reading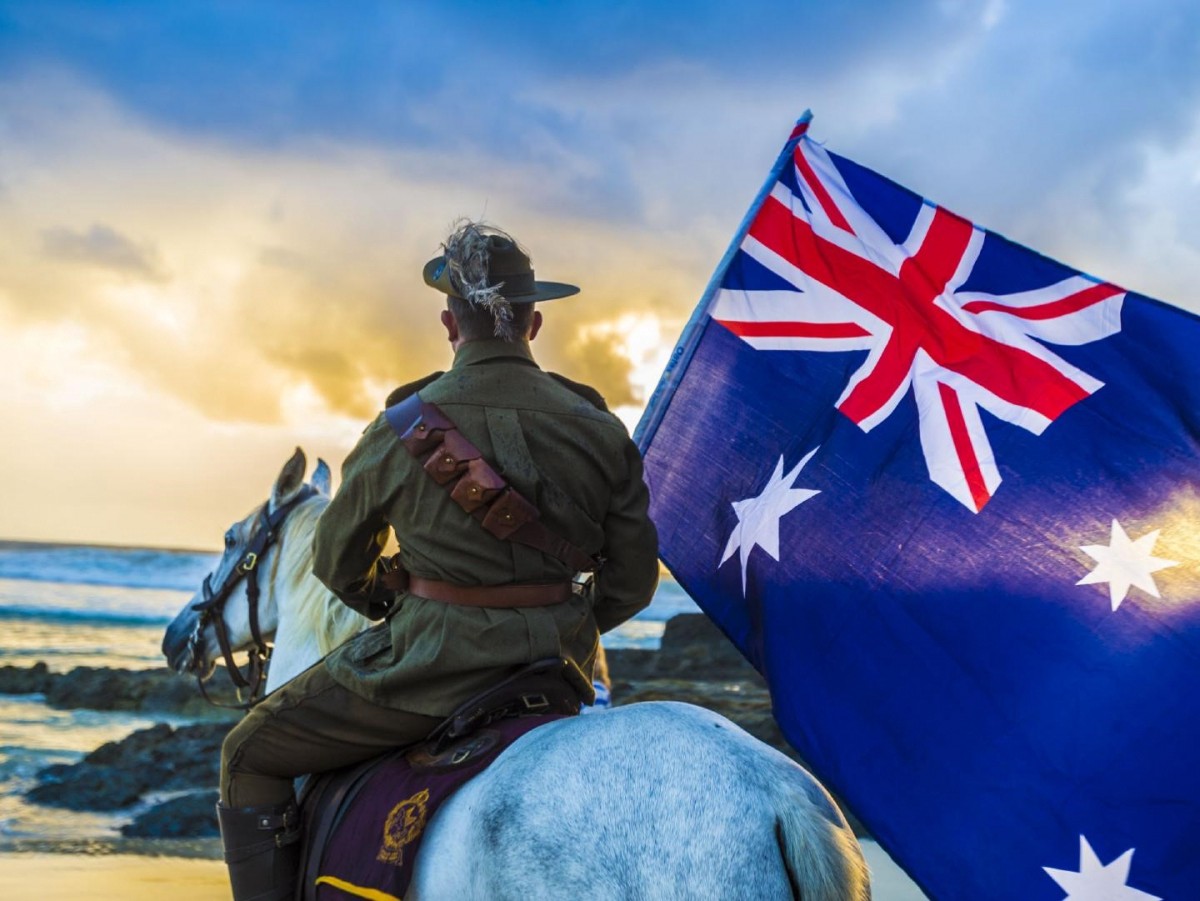

ANZAC Day: For Skippy
He was an Aussie serving with the NZ Army…he trained at Puckapunyal, Canungra and Singleton…many of the places mentioned in this song he has been to.
Keep reading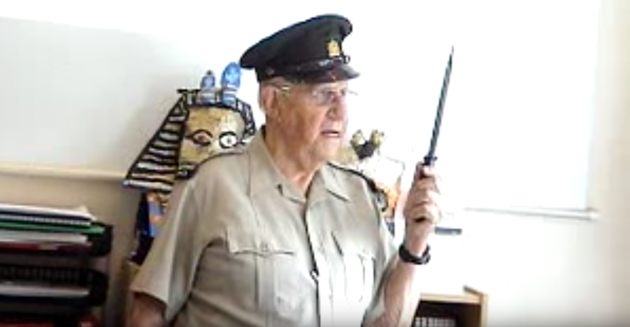
ANZAC Day: True Unsung Heroes
Wyn Fountain served as a Welfare Officer in the Middle East and Europe and was away for over four years. Later he ran a very successful business in New Zealand and, with wife Shirley, grew a great family.
Keep reading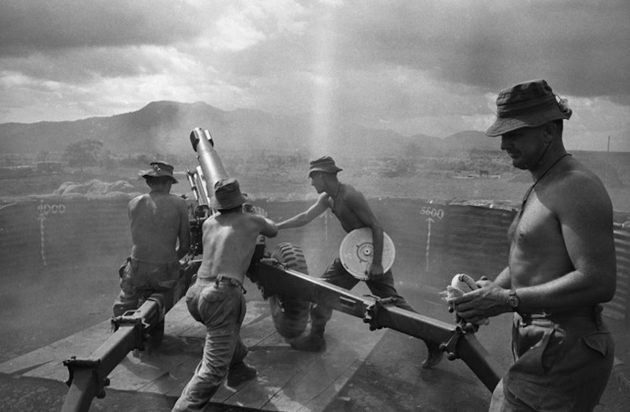
ANZAC Day: The Battle of Long Tan
This is the documentary made by Martin Walsh of the battle my father-in-law Skippy fought. The battle of Long Tan.
Keep reading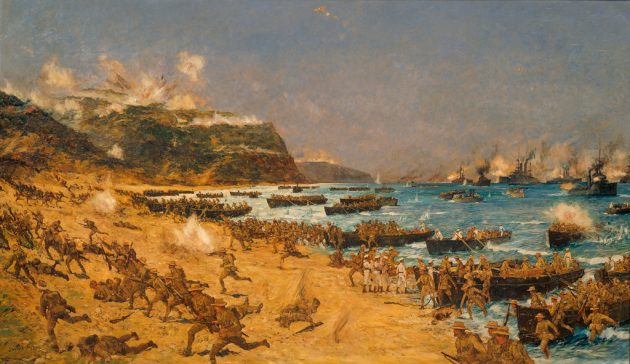
ANZAC Day: Gallipoli
In 2015 Dad and I were at the dawn ceremony at ANZAC Cove and then the service at Chunuk Bair.
Keep reading
ANZAC Day: Lest we forget
This is my ANZAC Day tribute posting. ANZAC Day means a great deal for me and my family. I suppose it is because we have a connection to the original ANZACS in 1915 and Gallipoli, and to a veteran of a war much fresher in our minds, Vietnam.
Keep reading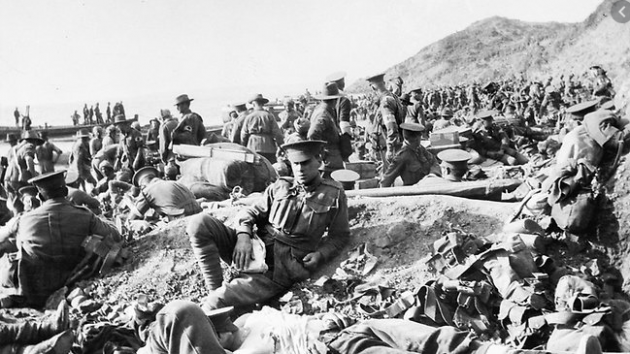
ANZAC Day: The Band Played ‘Waltzing Matilda’
The Pogues-The band played Waltzing Matilda
Keep reading
The BFD General Debate
Good morning, welcome to our daily General Debate. On General debate, you are encouraged as a commenter to share your own stories, discuss other news, bring NEW news, catch up with friends or make new friends with other commenters. To participate you’ll need to sign up for a Disqus account which is free, quick, and…
Keep reading
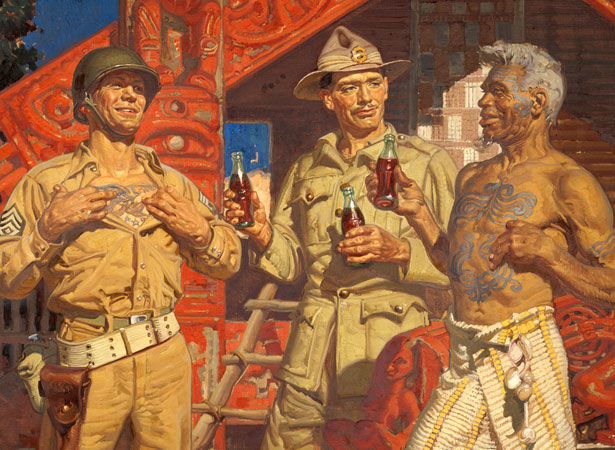
Face of the Day
Chief Petty Officer Tapene, from Hikurangi, north of Whangarei, enlisted in 2001. He specialised in communications and has since deployed throughout Asia, Hawaii, the Gulf of Arabia and Australia.
Keep reading

The BFD Daily Proverb
If the godly give in to the wicked, it’s like polluting a fountain or muddying a spring.
Keep reading
The BFD Nightcap
Enjoy a BFD curated video this evening. We search the internet for the best new media news and entertainment videos for our readers so that they don’t have to.
Keep reading
Wednesday Weapons
Enjoy a BFD curated video this evening. We search the internet for the best new media news and entertainment videos for our readers so that they don’t have to.
Keep reading
What Actually Happens When You Overfill Your Motor Oil?
Enjoy a BFD curated video this evening. We search the internet for the best new media news and entertainment videos for our readers so that they don’t have to.
Keep readingLoading…
Something went wrong. Please refresh the page and/or try again.
This Bulldozer Changes Everything Israel’s Insane D9 Caterpillar!
Enjoy a BFD curated video this evening. We search the internet for the best new media news and entertainment videos for our readers so that they don’t have to.
Keep reading50 Miles On An Inflatable Raft Through The Desert
Enjoy a BFD curated video this evening. We search the internet for the best new media news and entertainment videos for our readers so that they don’t have to.
Keep reading
The BFD Daily Roundup
Just a brief note to readers who like to add their own contributions to Daily Roundup in the comments. This post is for family-friendly humour ONLY thank you.
Keep reading
The BFD Backchat
On Backchat, you are free to share your own stories, discuss other news or catch up with friends. To participate you’ll need to sign up for a Disqus account which is free, quick, and easy.
Keep readingToday in Rock History
Today in Rock History is a music orientated segment where we would like to encourage readers to share their thoughts and tastes in music and discuss the various aspects of any music topic.
Keep reading
The Intifada Comes to America. Now What?
“Death to America!” We are used to that chant. Maybe too used to it.
If you are old enough, you heard it in 1979 during the Iranian hostage crisis when supporters of Ayatollah Khomeini invaded the U.S. Embassy in Tehran.
Keep reading
Waleed Dodges and Bullshits Again
Waleed Aly tries his best to baffle with prolix bullshit, but his agenda is all-too-clear.
Keep readingThe BFD Stuff Up of the Day
Check out the latest media stuff ups both locally and around the world.
Keep readingLaughter Is the Best Medicine
This regular daily post is the place to joke and banish negative thoughts.
Keep reading
Brown Shirts on Campus
“Pro-Palestine” students are demanding shows of hands in class — photographing dissenters.
Keep reading
Not the ‘Weed’ That You Grew up With
Today there are many different cannabis concentrates that have high levels of THC, typically ranging from 40% to 70%, and more than 80% in some cases, depending on the method of extraction.
Keep reading
A Diesel in the Shed
Today, after Aussies have enjoyed decades of abundant reliable cheap electricity from coal, green energy gambling has taken Australia back to that era which kept a diesel in the shed.
Keep readingLoading…
Something went wrong. Please refresh the page and/or try again.